Each year, California population increases by 400,000 people. That’s a growth rate of roughly 1 percent per year. The number of people living in California currently is approximately 38 million.
According to the California Environmental Protection Agency Air Resources Board (ARB), in 2000 state population reached 34 million, state-registered motor vehicles totaled 23.4 million and the miles traveled by those vehicles weighed in at 280 billion. If the number of registered vehicles in state grew at that same 1 percent per year rate, California would today be home to 26.2 million cars, trucks, SUVs, etc. But that’s not quite what has been occurring.
In 1990, meanwhile, according to ARB figures also, state population was 30 million, total state-registered vehicles was 23 million and vehicle miles traveled (VMT) in California that year was 242 billion. During the decade between 1990 and 2000, population had grown by an average 400,000 per year, vehicle population increased annually by an average 40,000 and the mean per-year rise in VMT was 3.8 billion.
While population growth has remained a steady 1 percent per year, between 1990 and 2000, vehicle population annually only rose by 0.17391 percent. Meanwhile, percent VMT growth during those ten years was 15.7 which means, the per-year rise in VMT was 1.57 percent. What this says is the ratio of the growth of VMT relative to growth in vehicle population is nearly 10-to-1, which, not only means VMT is outpacing population and vehicle population rise, but the growth in roadway expansion also. Demand is far outweighing supply.
Whereas in the first installment transit train efficiency/performance was discussed, in this, Part 2, considered is the growth in VMT and what effect this has been having on personal automated mobility.
Putting up parking lots?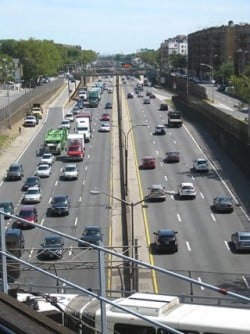
In their book, “The Road More Traveled: Why the Congestion Crisis Matters More Than You Think, and What We Can Do About It,” authors Ted Balaker and Sam Staley sum the delay situation up thusly: “During the last several decades, our driving has more than doubled, and yet our leaders have expanded our roadway system hardly at all. It’s not surprising that congestion has shot up over 200 percent nationwide. The average American spends more than an entire workweek stuck in congestion—and it’s much worse in our big cities.”1
In one of my first blogposts I noted that the Los Angeles region was home to the nation’s worst traffic congestion and of the country’s top 10 most congested freeways, the L.A. area has five.
So, just how bad is traffic delay there? Those with inquiring minds interested in knowing what, in 2011, that was like, would do well to consult the “Performance Measure Summary – Los Angeles-Long Beach-Santa Ana CA” document from the Texas A & M Transportation Institute (TTI).
Included in the aforesaid TTI document is the following data: The 13,229,000 residents, 7,289,000 peak travelers, 6,597,000 commuters, 254,783,000 daily vehicle miles traveled on 25,827 freeway- and arterial-street-lane-miles combined, has resulted in a total annual delay of 501,881,000 person-hours and 61 peak auto commuter person-hours. What this means is that the average L.A. area commuter is stuck in traffic 61 hours per year.
It is important to note, however, that pre-Great Recession peak auto commuter person-hour delay in 2006 was 79 and, at the height of the recessionary slump in 2008, such was 57. Likewise, total person-hour delay was 632,212,000 and 459,579,000 in 2006 and 2008, respectively. Such has seen steady rise since 2008. What this suggests is as the economy recovers and the ranks of the unemployed are reduced, car commuting in the Los Angeles-Long Beach-Santa Ana area is resuming its upward ascent.
What has been transpiring in the L.A. region could very well mirror what has been going on nationally or vice versa.
Nationwide, drivers have encountered an annual total 5.52 billion hours of delay. This is down from 5.94 billion in 2006 but up from the 5.23 billion in 2008 and is based on data from a total of 498 urban areas reporting in 2011. Average annual commuter delay is 38 hours. This is down from 43.1 in 2006 but up from 37.6 in 2008, according to information in the 2012 Urban Mobility Report, also from the TTI.
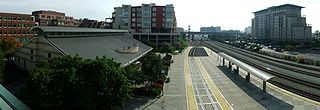
Now, carrying capacity-wise, trains, with far less infrastructure needed (and transit buses too, for that matter), win hands down over motor vehicles. In addition, trains outperform both transit buses and motor vehicles when it comes to fuel efficiency and effectiveness when it comes to moving the masses. The trade-off, though, is the comfort, eco-friendly nature, regularity, reliability, safety and, in some cases, speed that public transportation utilization affords the patron taking advantage of the service, is exchanged for the enhanced access and greater personal freedom afforded the automobile driver (and passengers). The side of the driving function not so relished, on the other hand, is the stress and hassle that frequently accompanies driving.
The focus of Part 3 is on transit bus efficiency/performance.
Notes:
- Ted Balaker and Sam Staley, “The Road More Traveled: Why the Congestion Crisis Matters More Than You Think, and What We Can Do About It,” 2006, p. 5.
– Alan Kandel